
Construction of de Bruijn Graphs for Sequence Assembly
Procedure
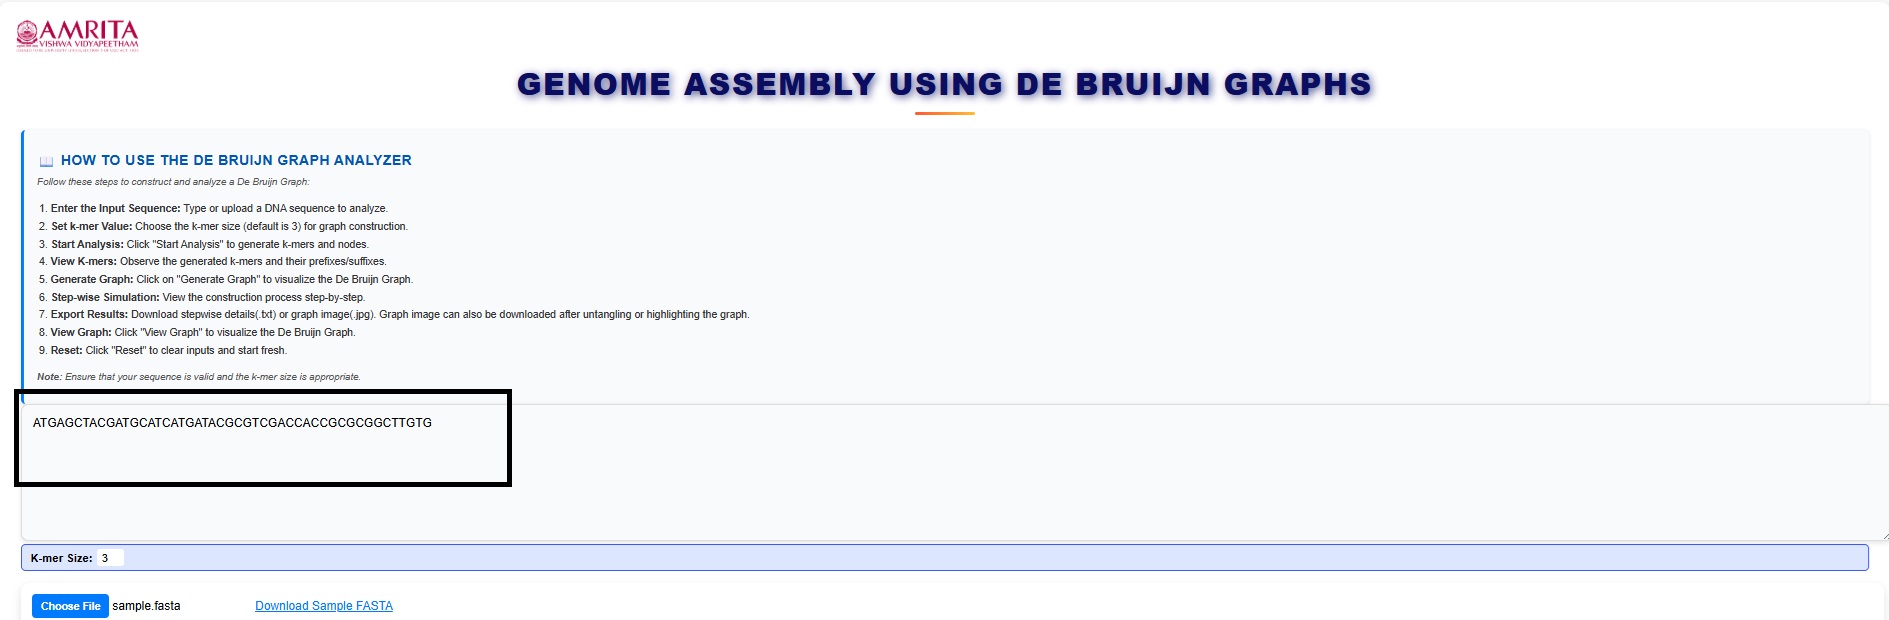
- Open the simulator window. Read the general instructions on how to use this tool before starting the simulation.
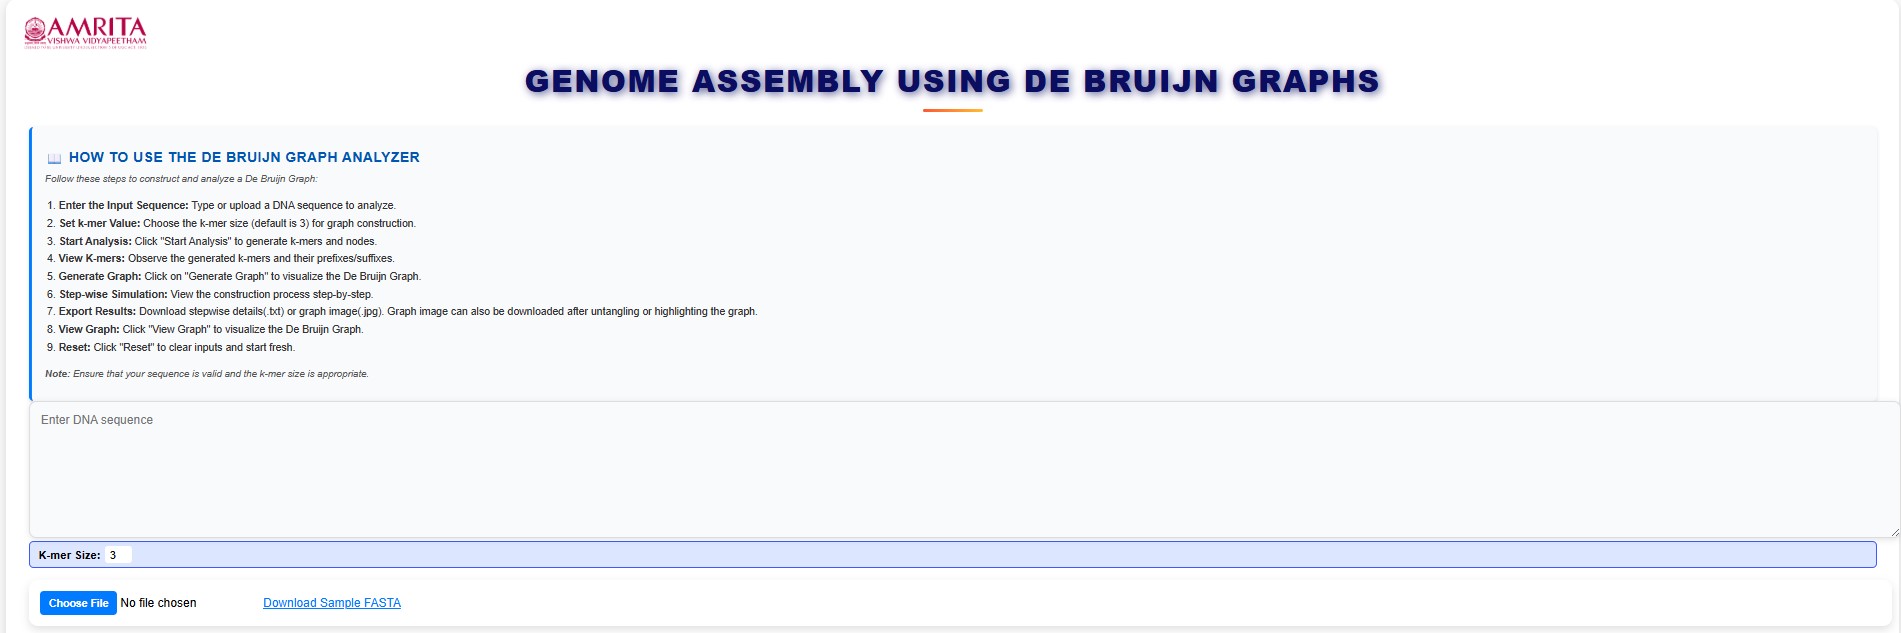
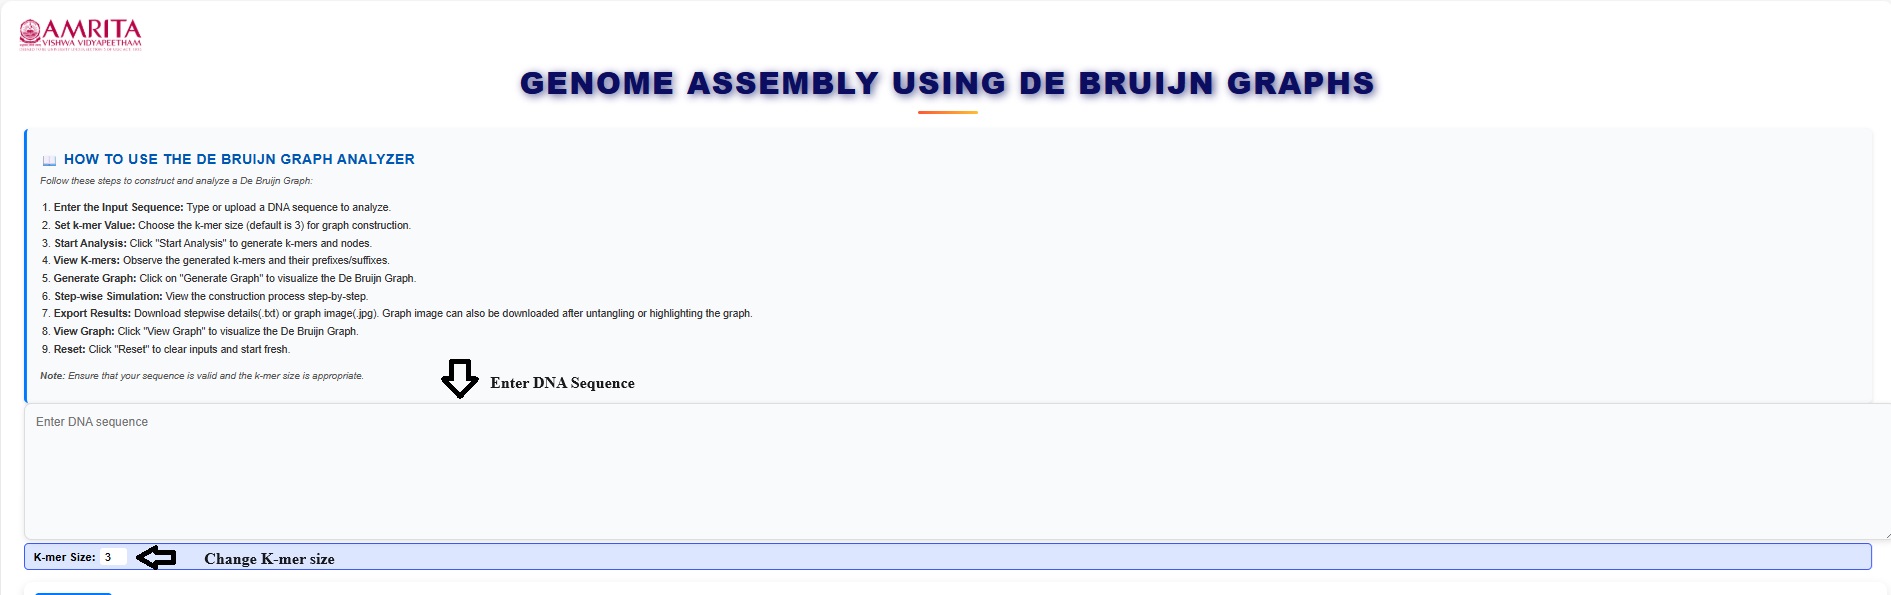
- To start the experiment, users can enter the DNA sequence of interest. They can also change the k-mer size by clicking the K-mer size box in the simulator window.
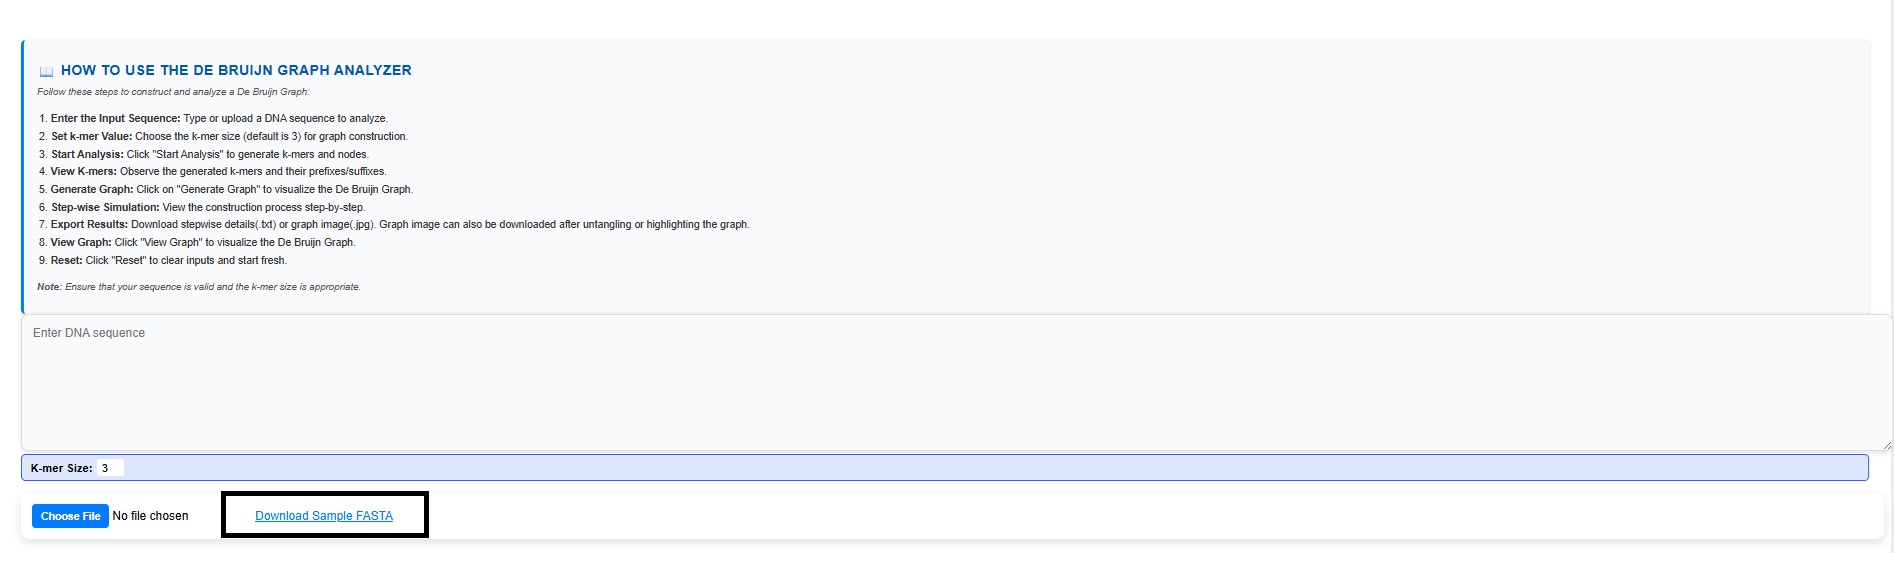
- To practice the simulator, instead of step 2, users can download a sample DNA file in FASTA format provided in the GUI.
- Then upload the downloaded file (DNA sequence) by clicking Choose file menu.
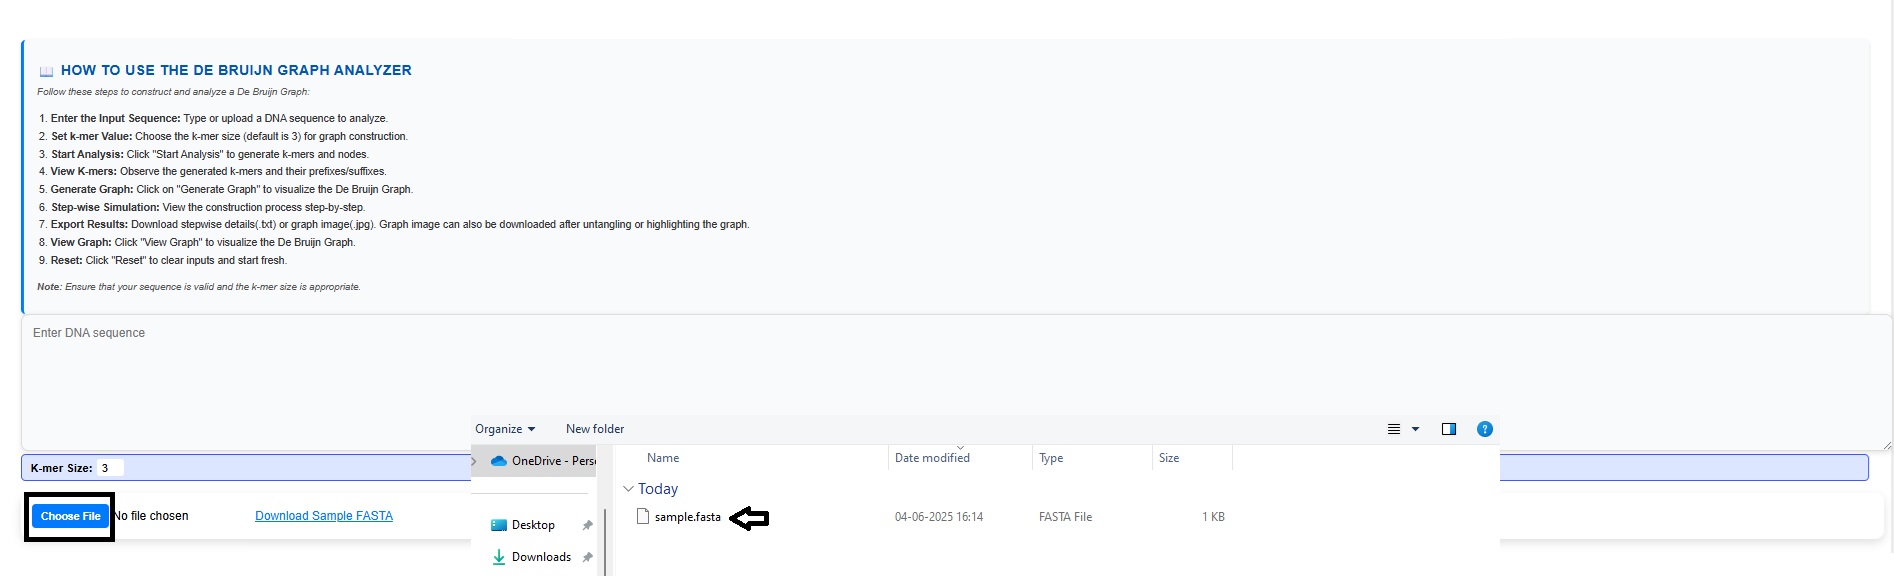
- When the file is chosen, the DNA sequence gets entered in the text box.
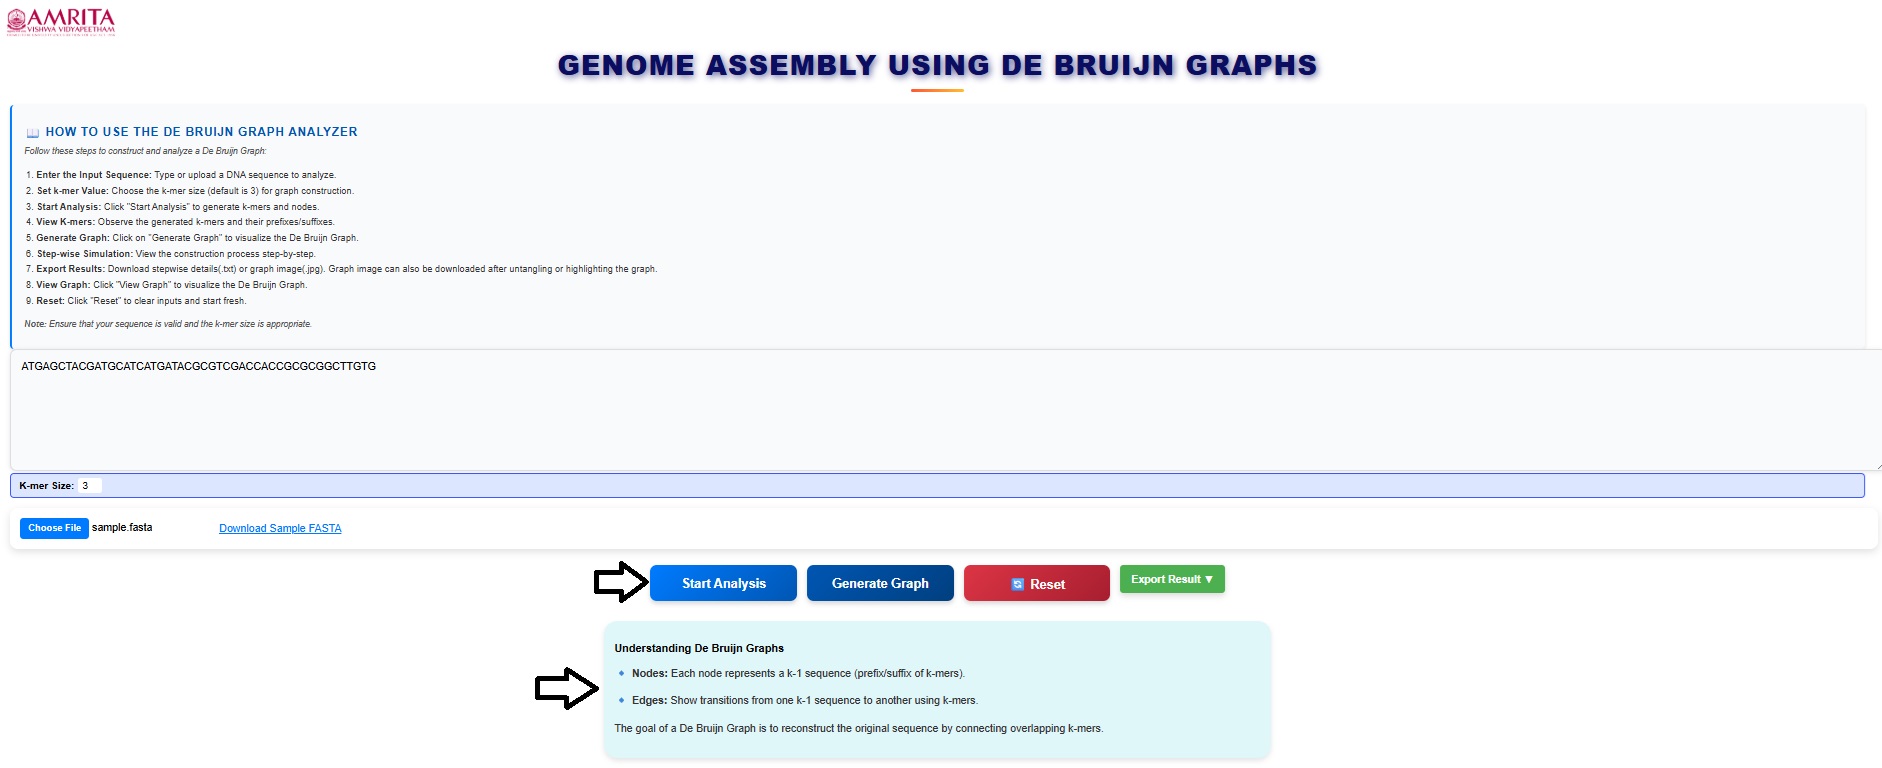
- Then click on start analysis to visualize the result. Read the basics of the De-Bruijn graph in the box provided in the simulator window.
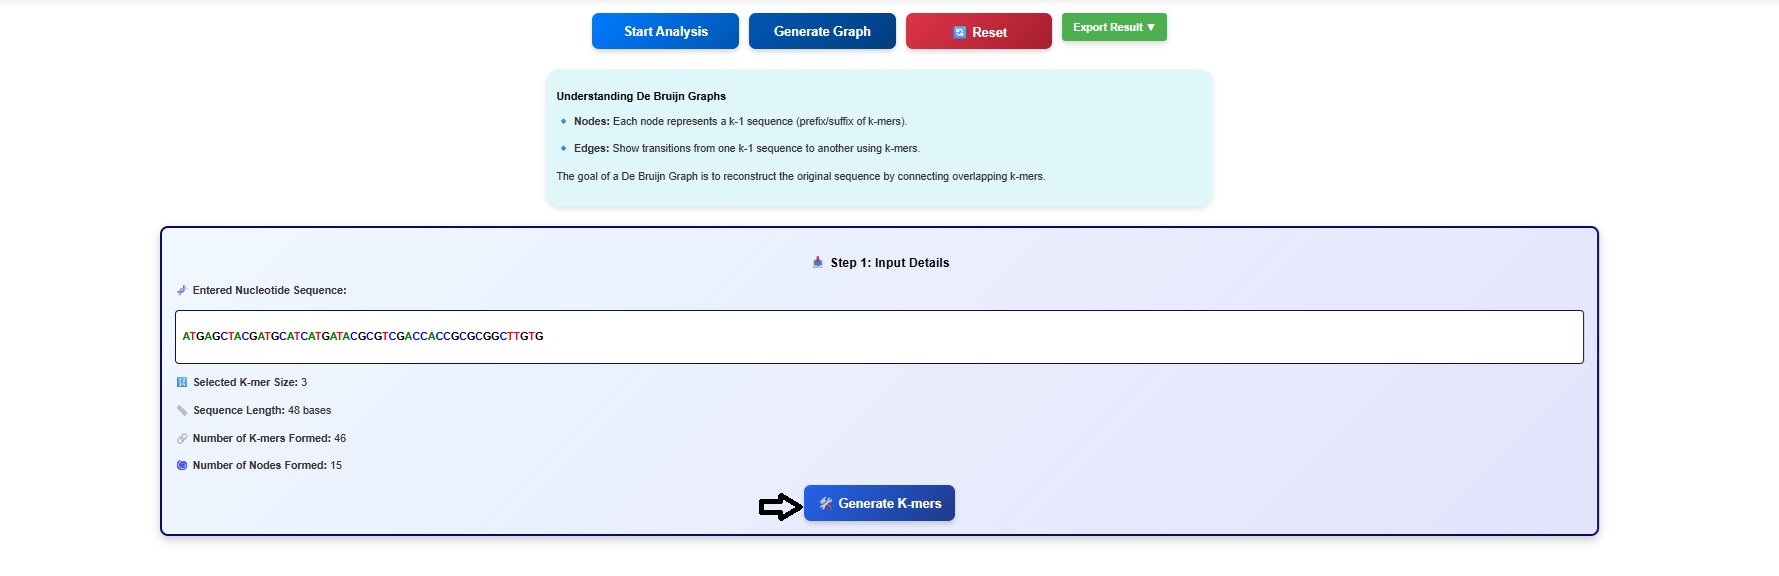
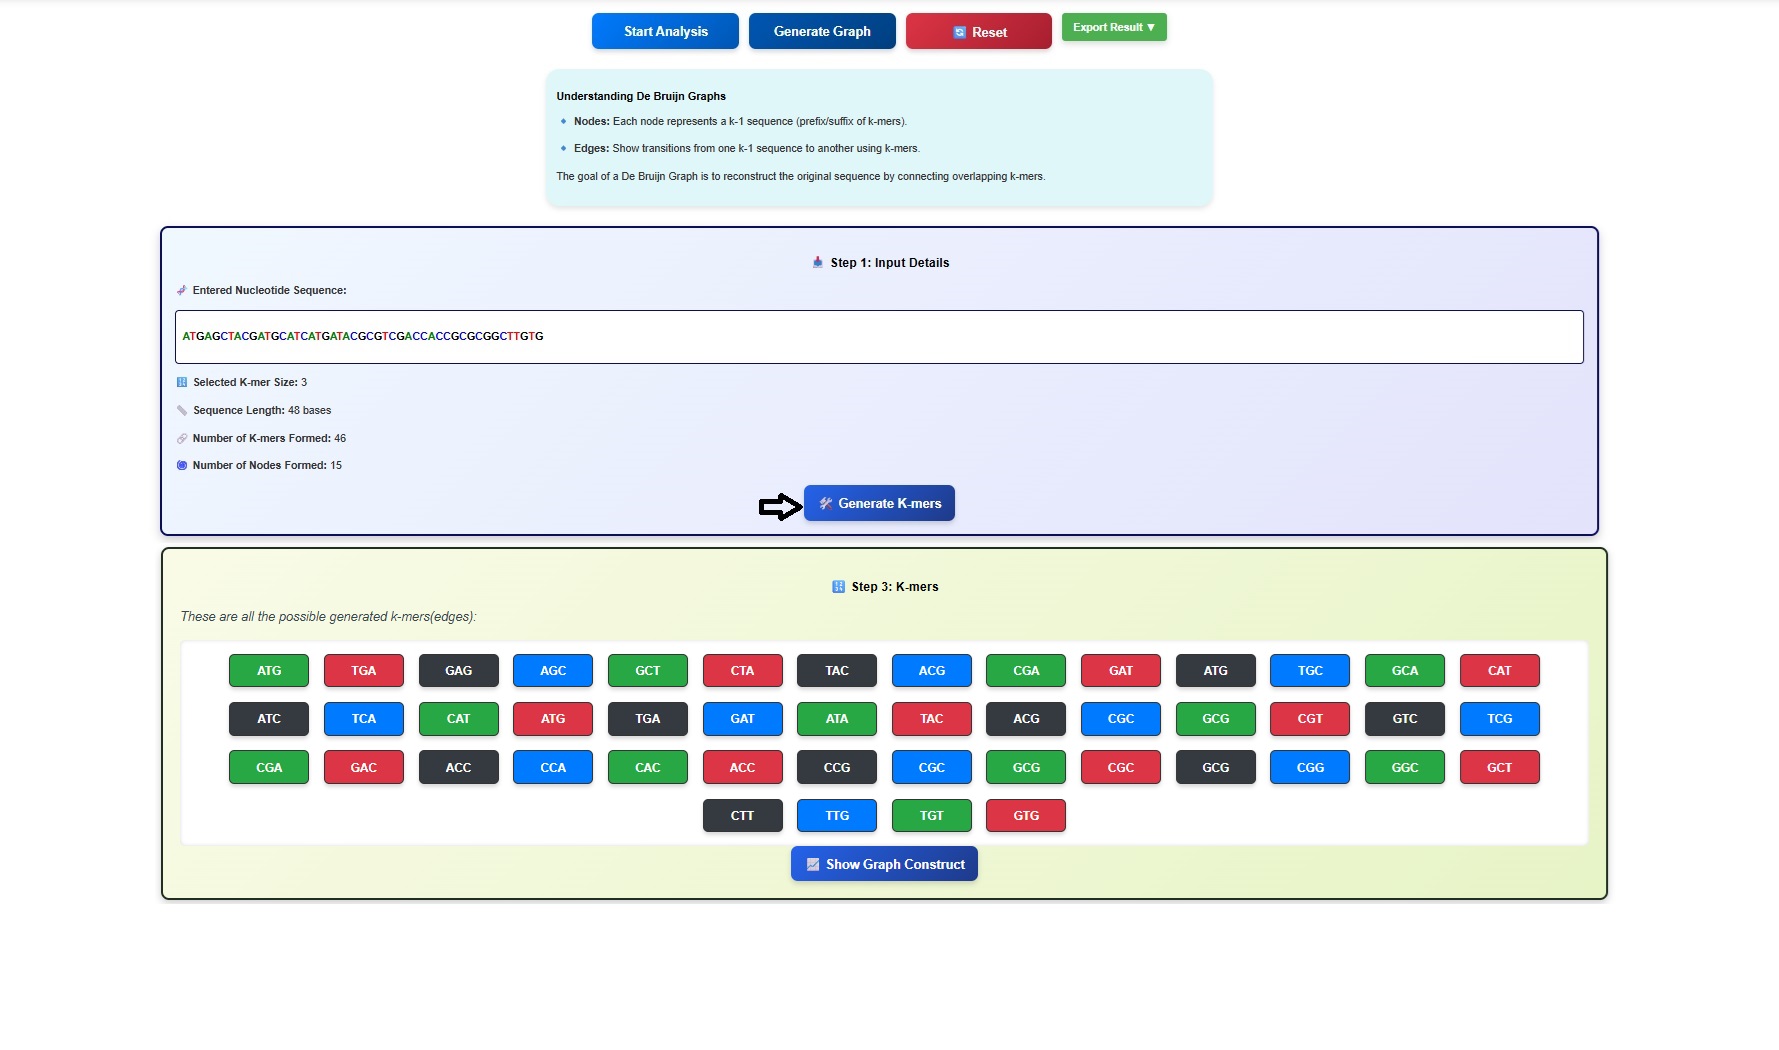
- The input details are displayed in the GUI. Read and understand the input details.
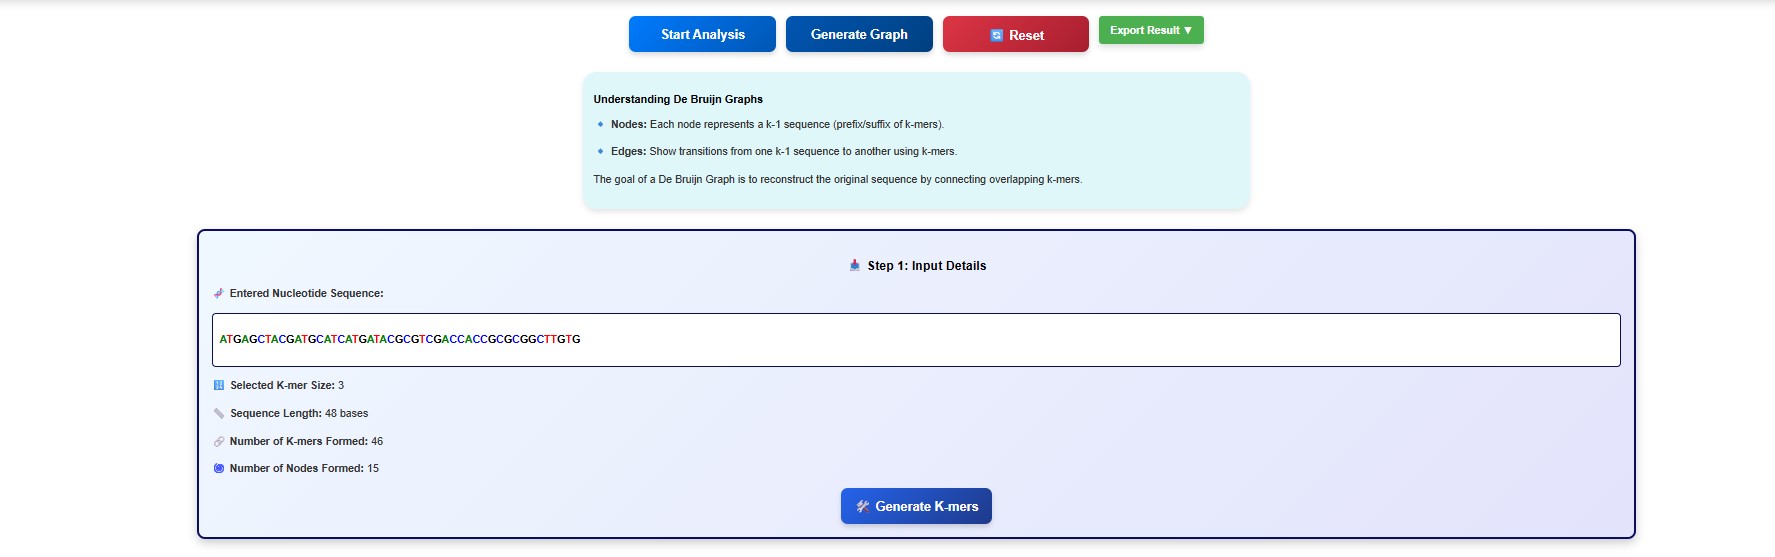
- Next click on the Generate K mers tab.
- The k-mers and its suffix and prefix gets displayed in the simulator window. Users can scroll the window to observe all the k mers and associated suffix and prefix.
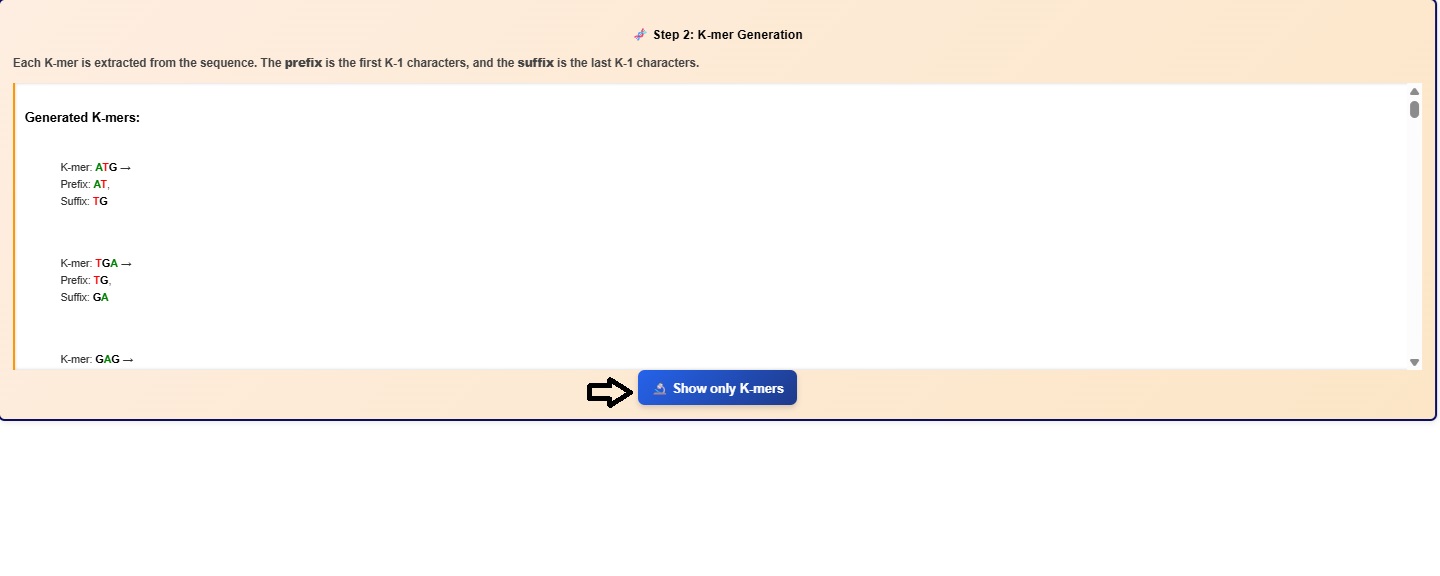
- Click on the Show only K-mers button to visualize the k-mers.
- Click on Show Graph Construct button to observe the nodes. Users can scroll down to observe the list.
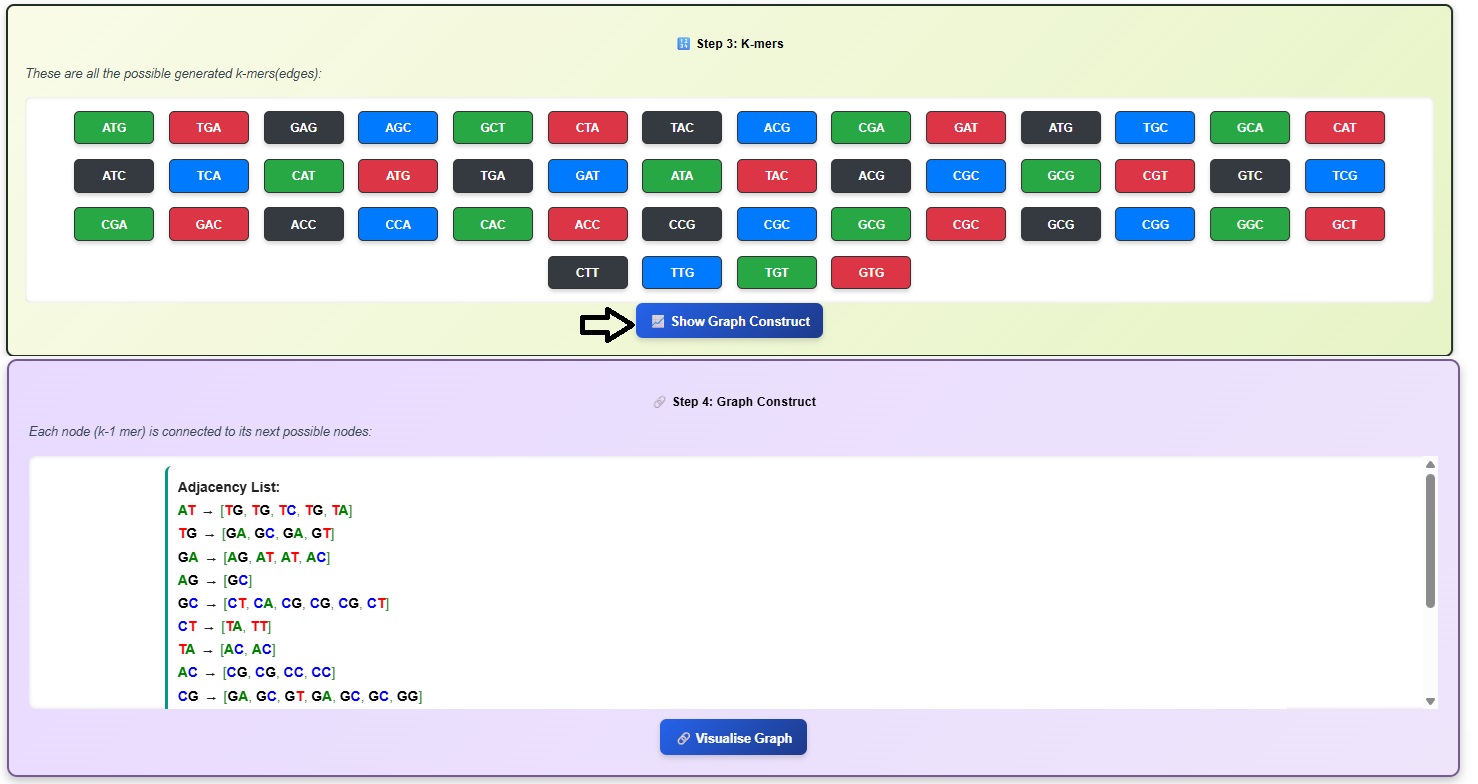
- Click on Visualize Graph button to observe De- Bruijn graph.
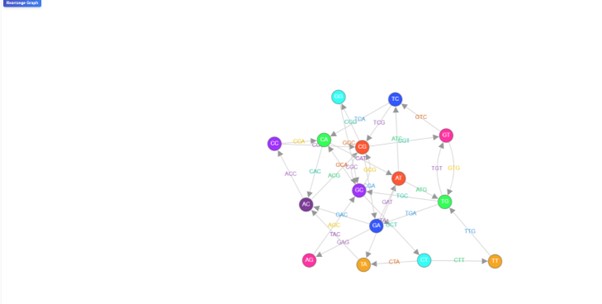
Here the nodes represent (k−1)-mers, and edges represent k-mers.
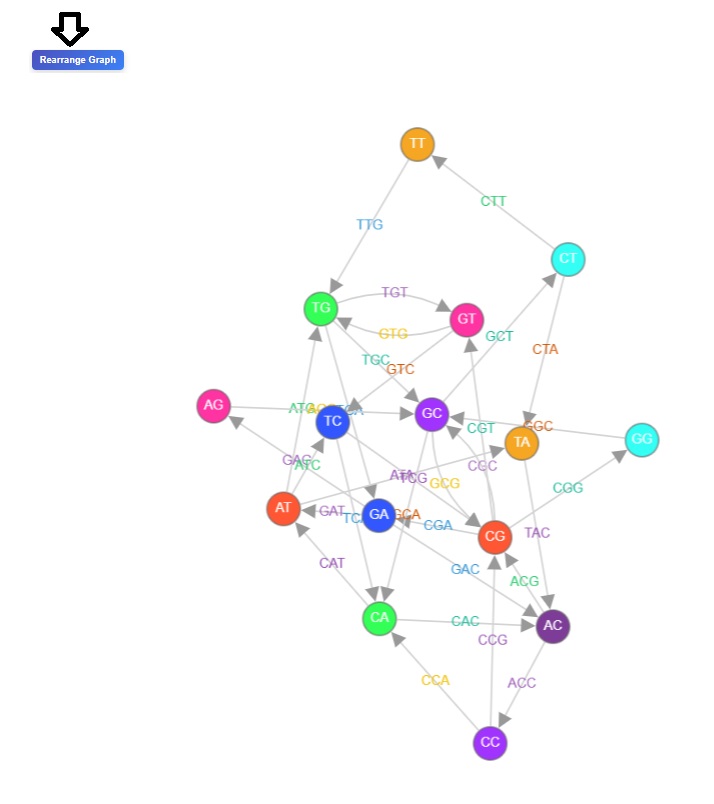
- Users can click on the rearrange button to observed re-arranged version of the De Bruijn graph.
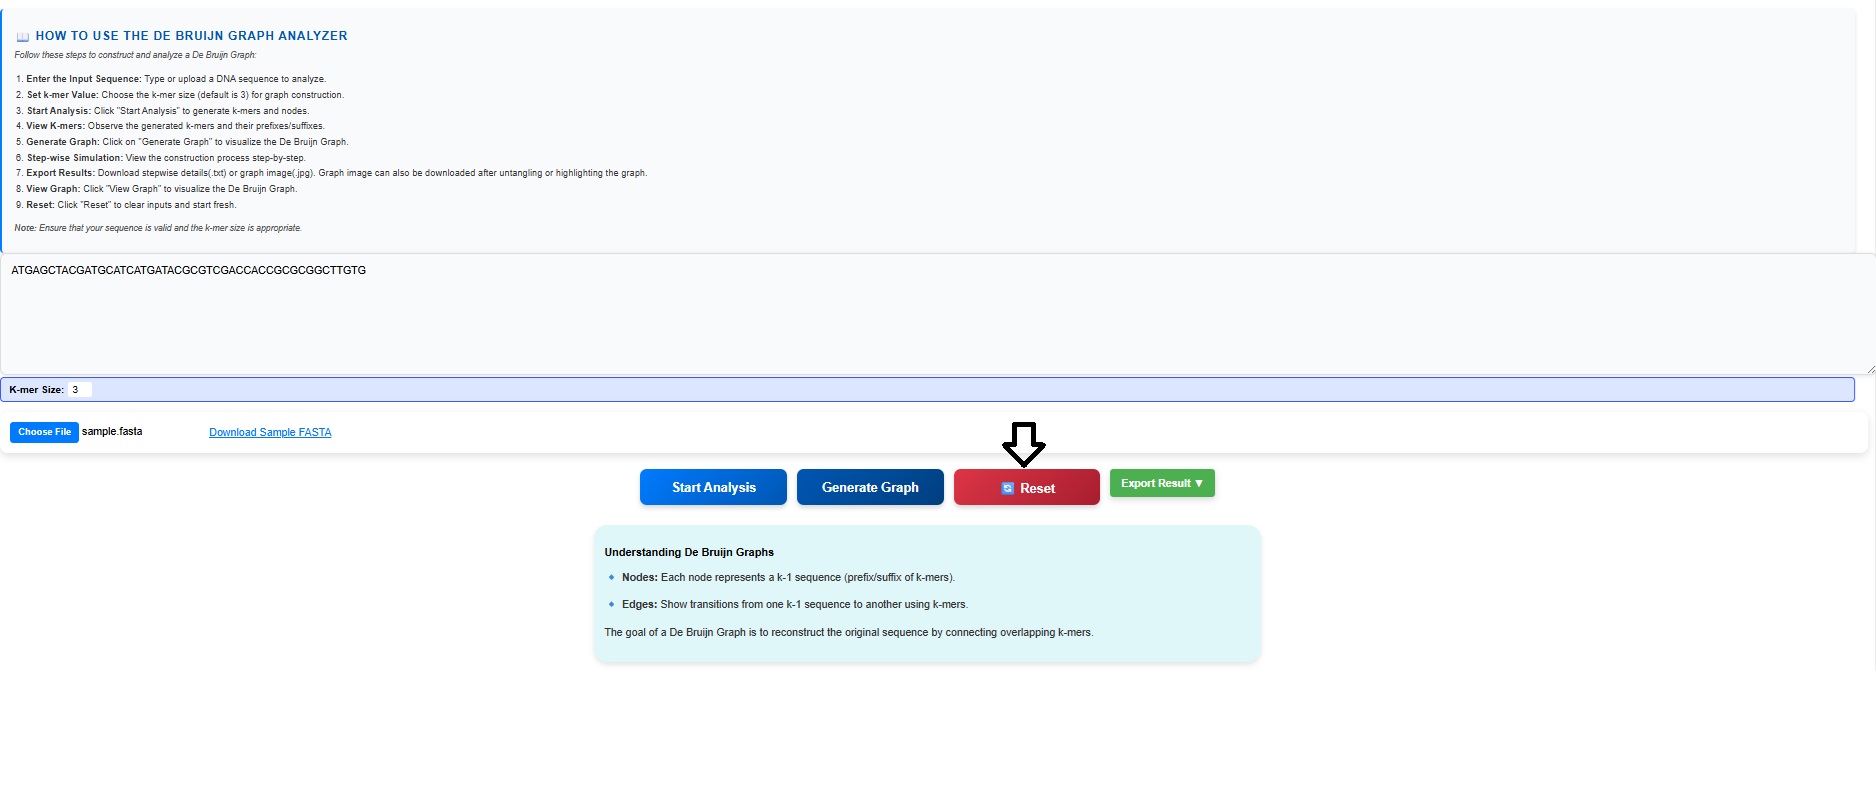
- Click on the reset button to re-start the experiment.
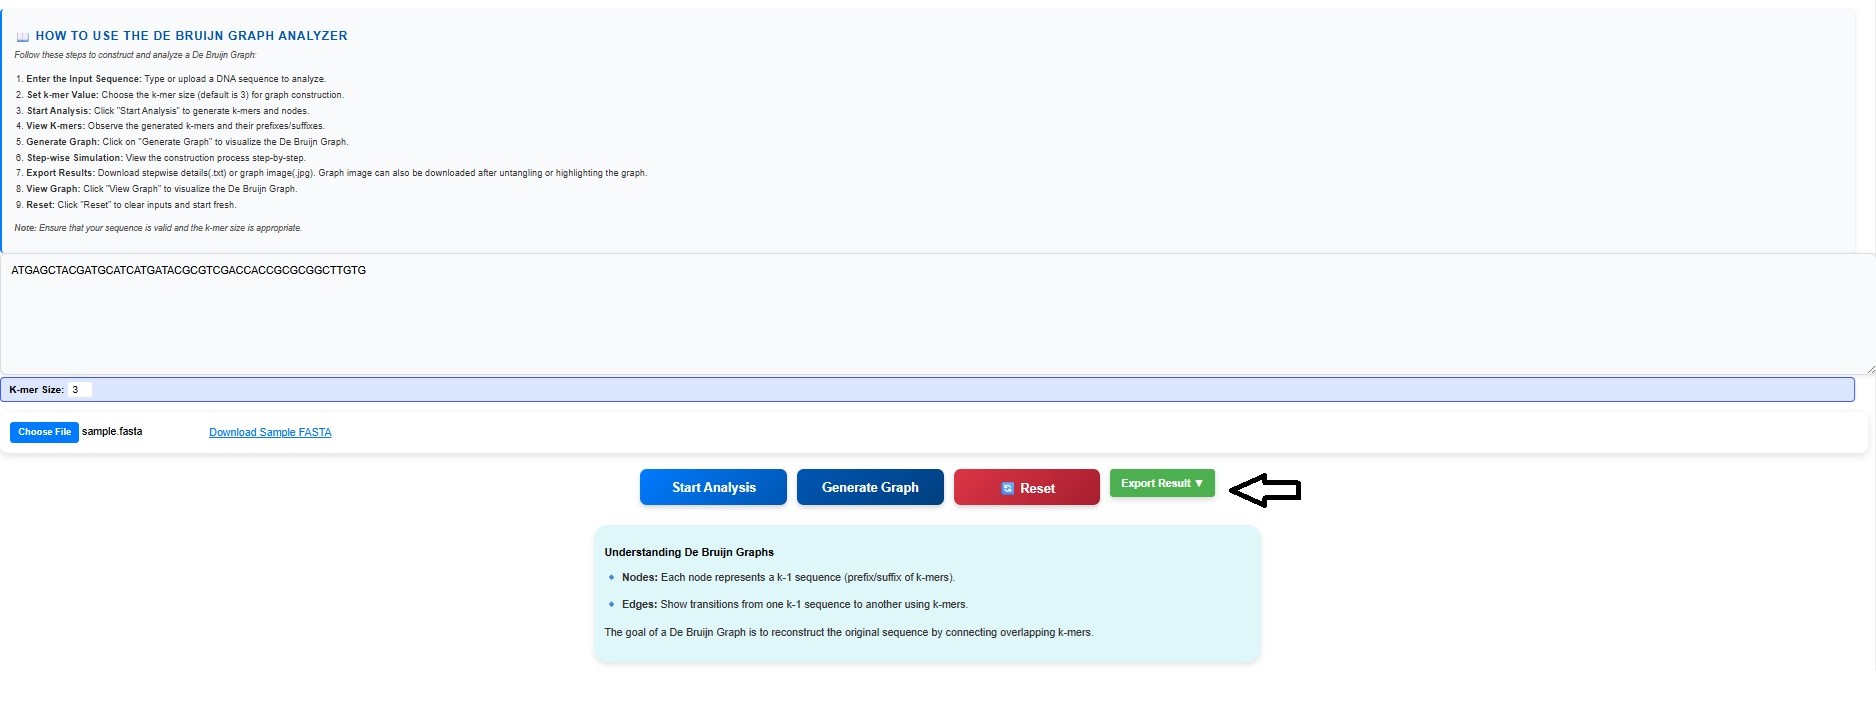
- Click on the Export Result button to get the step-wise construction of the graph and de-Bruijn graph of the provided input sequence.